Back to Blog
by Finage at March 27, 2022 3 MIN READ
Stocks
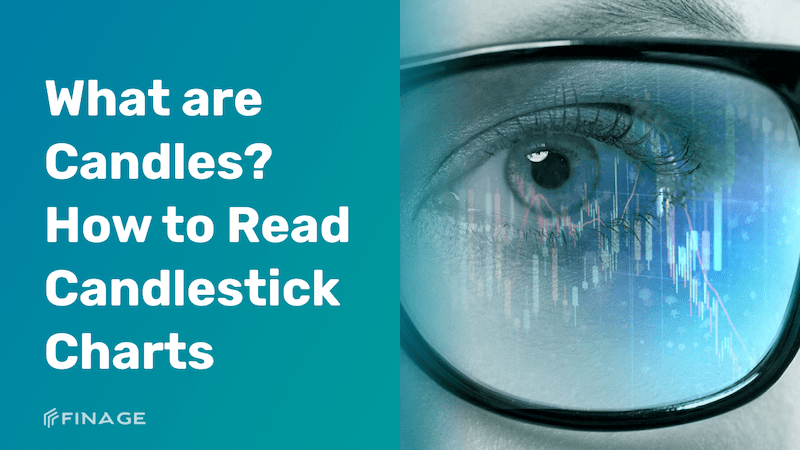
What are Candles? How to Read Candlestick Charts
What is Candlestick Chart?
A candlestick chart is a chart of individual candles that traders use to understand price action. Candlestick price action involves detecting where the price has opened for a period, the price high for some time closed, and a low for a certain period.
Price action can give traders of all financial markets clues to trends and reversals. For example, candlestick groups can create patterns that can show reversals or continuation of trends throughout forex charts. Candlesticks can also form individual formations that can indicate trading entries in the market.
The duration each candle shows depends on the time frame chosen by the trader. A popular timeframe is a daily timeframe, so the candle is shown as open, close, high, and low throughout the day. The different components of a candle can help you predict where the price will go, for example, if a candle closes well below the open, it could show further price declines.
How To Read a Candlestick Chart?
There are several ways to use and read a candlestick chart. Candlestick chart analysis depends on your preferred trading strategy and timeframe. Some strategies try to take advantage of candle formations, while others try to recognize price patterns.
Individual candlesticks can give a lot of insight into current market sentiment. Candlesticks like Hammer, falling star, and hanging man provide clues as to changing momentum and potentially where market prices might head.
Hammer candlestick formation sometimes indicates a trend reversal. The hammer wax formation has a long lower wick with a small body. The closing price is above the opening price. The hunch behind the hammer formation is simple, the price tried to drop but the buyers pushed the price up to and entered the market. Entering the market, tightening stop-losses, or closing a short position is a bullish signal.
Traders can take advantage of hammer formations by making a long trade after the candle has closed. Hammer candles are advantageous because traders can apply a 'tight' stop-loss. Take-profits should be placed in such a way as to ensure a positive risk-reward ratio. That is, the loss of taking profit is ever greater.
We are professional software developers for the Forex market. Check out our expert advisors. Many traders rely on automated trading on their accounts. If you are a beginner in the financial market, trade with our help Developed by our best forex robot programmers.
Candlestick charts help traders recognize price patterns that appear on the charts. By recognizing these price patterns, bullish swallow patterns, or triangle patterns, you can use them as signals to enter or exit the market. A bullish swallow is a combination of a red candle and a blue candle that 'encloses' the entire red candle. It is an indication that there may be an end of currency pairs detected by weakness. A trader can take advantage of this by entering a long position after the blue candle has closed. Remember, the price pattern is only formed when the second candle closes.
What Do Candlesticks Tell Us?
Candlesticks can reveal much more than price movements over time. Experienced traders look for patterns to gauge market sentiment and make predictions about where the market might go next. Here are some of the things they're looking for:
For example, a long wick at the bottom of a candle may mean that traders are buying an asset as prices fall, which can be a good indicator that the asset is bullish.
However, a long wick at the top of a candle may indicate that investors are looking to make a profit - indicating a large potential sale shortly.
Understanding what candlesticks can mean in a particular asset context or certain market conditions is one element of a trading strategy called technical analysis, in which traders try to use past price movements to identify trends and potential future opportunities.
We hope that this blog post will be beneficial for you. We will continue to create useful works to get inspired by everyone. We are sure that we will achieve splendid things altogether. Keep on following Finage for the best and more.
You can get your Real-Time and Historical Market Data with Finage free API key to learn more about them.
Build with us today!
Featured Posts
Sector Focus: Which CFDs Are Investors Watching Closely This Year?
April 24, 2024
What's New at Finage: Latest Features and Services for 2024
April 23, 2024
Predictive Analytics in Stock Market Investments: Latest Tools and Techniques
April 22, 2024
NFTs in the Entertainment Niche & Its Role in the Web3 Ecosystem
April 21, 2024
DeFi in 2024: Exploring the Growth & Impact on Traditional Financial Services
April 20, 2024
Categories
Forex
Finage Updates
Stocks
Real-Time Data
Finage News
Crypto
ETFs
Indices
Technical Guides
Financial Statements
Excel Plugin
Web3
Tags
What is Candlestick Chart?
How To Read a Candlestick Chart?
What Do Candlesticks Tell Us?
Stocks Candlestick Data
Forex Candlestick Data
Stocks Candlesticks Charts
Candlestick Charts APIs
Join Us
You can test all data feeds today!
Start Free Trial

If you need more information about data feeds, feel free to ask our team.
Request Consultation
Back to Blog
Please note that all data provided under Finage and on this website, including the prices displayed on the ticker and charts pages, are not necessarily real-time or accurate. They are strictly intended for informational purposes and should not be relied upon for investing or trading decisions. Redistribution of the information displayed on or provided by Finage is strictly prohibited. Please be aware that the data types offered are not sourced directly or indirectly from any exchanges, but rather from over-the-counter, peer-to-peer, and market makers. Therefore, the prices may not be accurate and could differ from the actual market prices. We want to emphasize that we are not liable for any trading or investing losses that you may incur. By using the data, charts, or any related information, you accept all responsibility for any risks involved. Finage will not accept any liability for losses or damages arising from the use of our data or related services. By accessing our website or using our services, all users/visitors are deemed to have accepted these conditions.