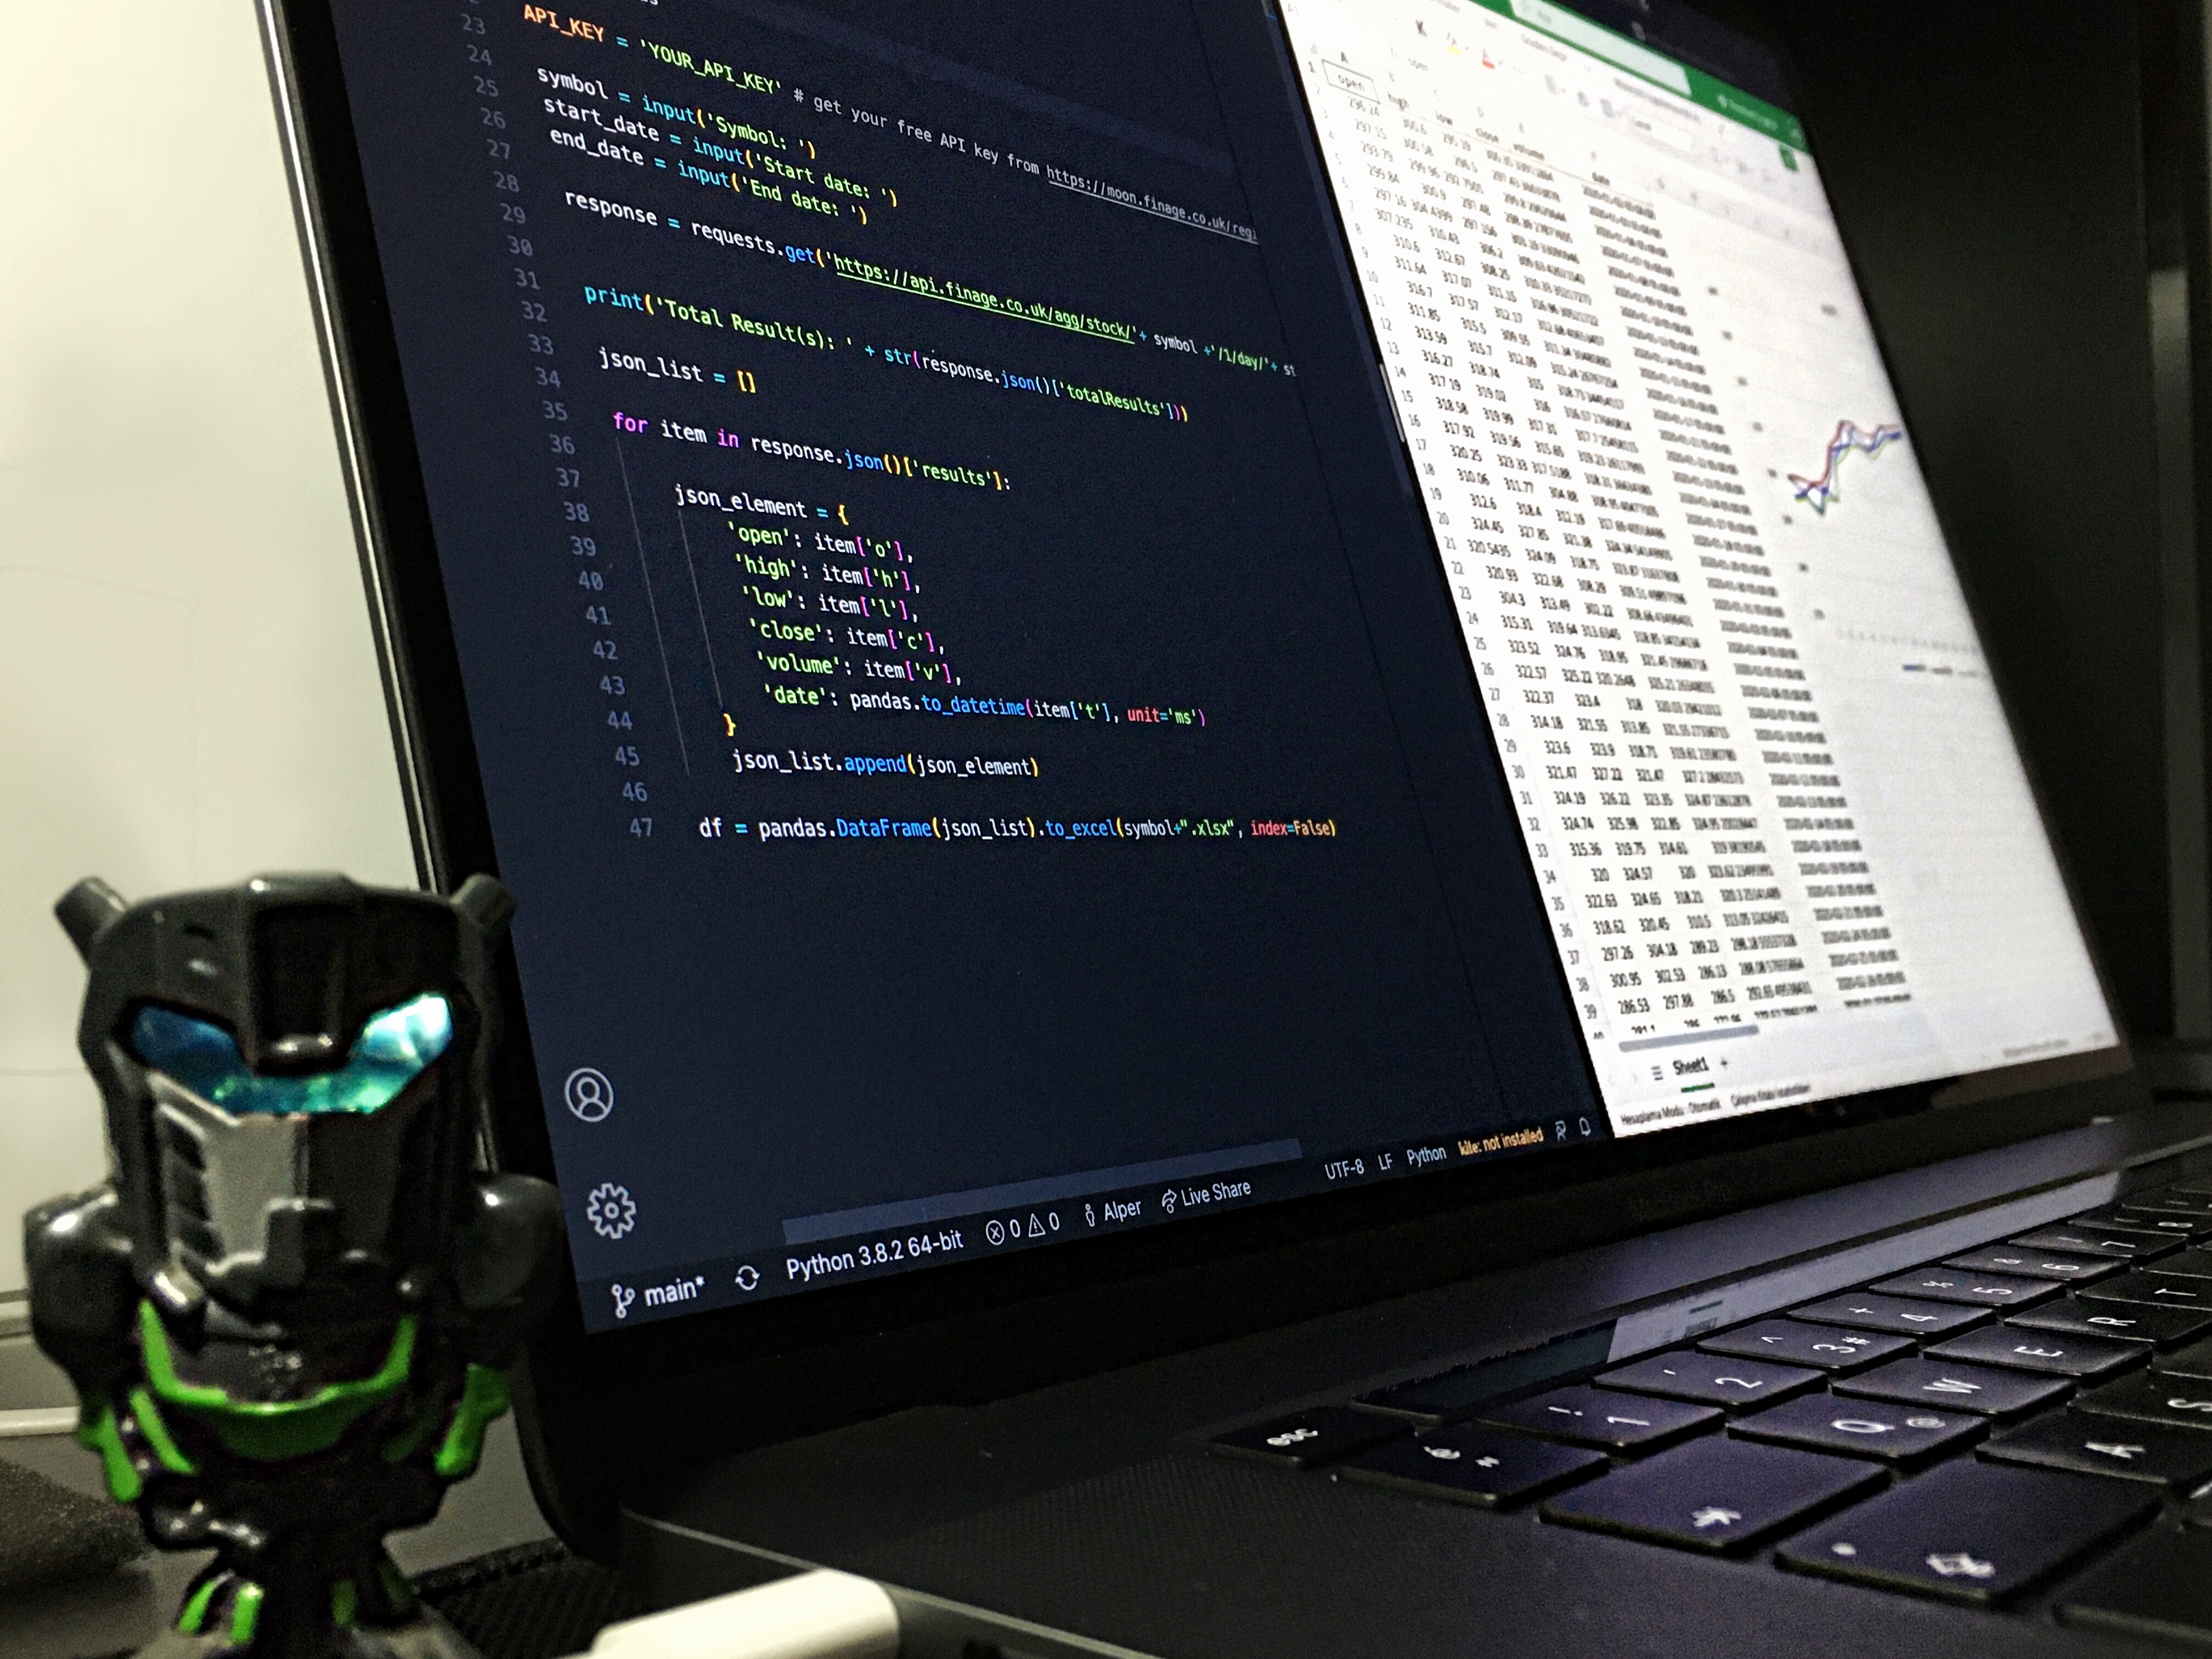
In this post, we will talk about how can we collect historical stock prices into Excel. Let's dive in.
We are going to use Pandas for this project. Also, we have to install Openpyxl too.
pip3 install pandas
pip3 install openpyxl
pip3 install requests
We need an API key to collect historical stock prices. You can get your free API key in seconds from the given link below.
Get your free API key by clicking here.
After the registration, go to the Moon Dashboard and click on the API in the menu. You will see your API key and the package details on this page. Click on your API key and it will automatically copy the key to the clipboard. That's all. We are ready to collect data.
Do not share your API key with anyone. If you want to regenerate a new API key, you can simply click on the "Regenerate Key" button and get your new API key quickly without losing your current package.
In the documentation, we are going to find and use Stock Market Aggregates API to collect historical OHLCV data. If you prefer, you can choose other endpoints.
Create a script.py file and open it with your favorite IDE.
import requests
API_KEY = 'YOUR_API_KEY' # get your free API key from https://moon.finage.co.uk/register?subscribe=API00
symbol = input('Symbol: ')
start_date = input('Start date: ')
end_date = input('End date: ')
response = requests.get('https://api.finage.co.uk/agg/stock/'+ symbol +'/1/day/'+ start_date +'/'+ end_date +'?apikey=' + API_KEY)
print('Total Result(s): ' + str(response.json()['results']))
python3 script.py
command. You will see the results in the terminal. Now, we have the data. It's time to write this data to Excel. This script will ask you the symbol, start date, and end date. Respectively, you can write "AAPL", "2020-01-01", "2020-03-01". import requests
import pandas
API_KEY = 'YOUR_API_KEY' # get your free API key from https://moon.finage.co.uk/register?subscribe=API00
symbol = input('Symbol: ')
start_date = input('Start date: ')
end_date = input('End date: ')
response = requests.get('https://api.finage.co.uk/agg/stock/'+ symbol +'/1/day/'+ start_date +'/'+ end_date +'?apikey=' + API_KEY)
print('Total Result(s): ' + str(response.json()['totalResults']))
json_list = []
for item in response.json()['results']:
json_element = {
'open': item['o'],
'high': item['h'],
'low': item['l'],
'close': item['c'],
'volume': item['v'],
'date': pandas.to_datetime(item['t'], unit='ms')
}
json_list.append(json_element)
df = pandas.DataFrame(json_list).to_excel(symbol+".xlsx", index=False)
Here you can see the full code of the project. When you run the script, it will show the total result in the terminal, and then it will create a new Excel file (.xlsx) near to the script.py file that named with the chosen symbol.
It's that easy to collect historical stock data into Excel. Also, you can draw charts in Excel with the collected historical stock prices.
Download the full code from the Github.
View the Documentation for more endpoints.
Access stock, forex and crypto market data with a free API key—no credit card required.
Discover company news, announcements, updates, guides and more