Logo

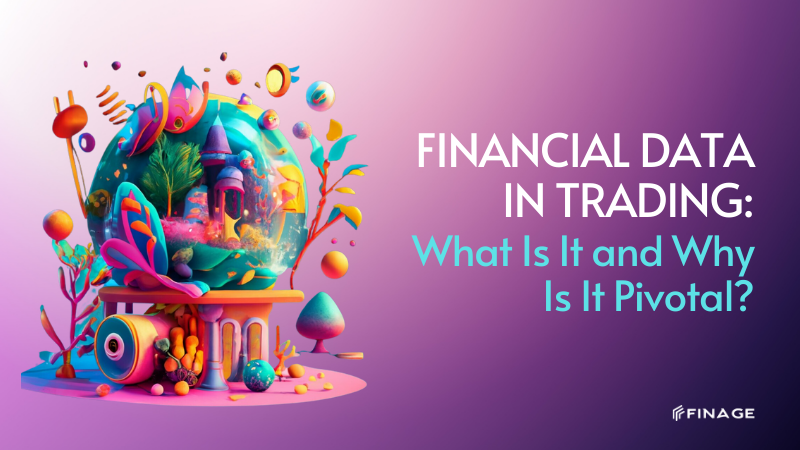
Financial Data in Trading: What Is It and Why Is It Pivotal?

7 min read • May 14, 2023

Article image

Share article

linkedinXFacebookInstagram

Introduction


In the face of the ever-changing financial landscape, many companies and individuals are seeking ways to stay ahead of the curve. They are trying to clarify what currently holds the utmost relevance in the digital transformation. As financial predictions are difficult, especially in today’s environment, embracing data intelligence is important.


Financial data, often called market feeds, has been available for as long as information has been in existence. Today, it can include both "pre-trade" details like a bid and ask data, crucial for the valuation of financial instruments, and "post-trade", for example, the most recent trade prices and other transaction details. Basically, the information related to all traded entities worldwide is considered to be financial data feeds according to Finage. But let’s delve into its pivotal significance!


Contents:

- What the data is saying

- Factors that influence data

- How to access it

- Types of data

- Categories and using API

- Final thoughts

What the data is saying

Data can suggest, help analyze charts, show the situation with the certain financial sector's non-performing assets or capital adequacy and do much more. The present landscape, which is also driven by crypto and blockchain tech, introduces us to new virtual tradable assets against traditional currencies. This also highlights the growing significance of data. Moreover, new concepts like NFTs and social DeFi have emerged within the last few years, introducing new possibilities into the niche.


Absolutely, a wide range of items like below can serve as financial information when they are traded in various markets:

- Companies

- Currencies

- Metals

- Food

- Commodities

- Coins

- Other tradable entities


Crucial elements of financial data in trading include:

- Assets

- Liabilities

- Income

- Expenses

- Cash flow

- ETFs

- Market prices

- Trading volumes

- Technical Indicators

- Indices

- Historical data

- Real-time data

- Cash flow and profitability

- Key financial ratios

- Equity and more

Factors that influence data

As you can see, financial data may include different information concerning companies and currencies, trading insights and startup performance or health. This spans a wide range of opportunities as long as you are engaged in trading activities and get a reliable data analysis. The value you choose to trade could be determined or influenced by a variety of factors, basically by the data you receive from:

- Market trends: impact the value of assets and influence trading decisions.

- Economic indicators: for example, GDP growth, unemployment rates, or inflation.

- Companies performance: stocks, financial health, and performance, KPI, etc.

- Interest rates that impact the value of currencies and bonds.

- Global events: economic and geopolitical events, natural disasters, and other circumstances that affect market sentiment.

- Supply and demand: as simple as it is, the availability of any traded asset.

- Technical aspects and indicators that can guide traders in predicting price movements.

- Trading analysis: getting the value of an asset based on its financial factors.

- Exchange rates: For forex trading, exchange rates between different currencies determine value.

- New technology: broader tech trends, crypto and tech advancements, and much more.


In the last years, we faced extraordinary development trends as well. Now we have crypto and blockchain. For the first time, we have something virtual tradable that changes the scene of the niche.

How to access it

Financial data can be accessed from a range of sources, providing diverse avenues to gather information. These sources are a variety of trading platforms and channels, companies that publish financial statements, social media and official websites or regulatory organizations.


Specialized data providers and brokers can offer comprehensive databases and services for a fee, while financial and trading websites can deliver real-time updates, historical data, and market insights. Agencies and central banks provide economic indicators.


Additionally, you can use APIs and widget feeds that help integrate data into apps, bots, and other systems. As well, this ecosystem of sources caters to the needs and pain points of investors, analysts, newbies, and other experts seeking reliable and up-to-date information. Usually, they are using various additional sources:

  • Public financial statements: companies like the SEC's EDGAR system publish balance sheets, income or cash flow statements
  • Financial News Websites like Yahoo Finance, Google Finance, and CNBC provide a wealth of data, including stock prices, market indices, and news
  • Government/Regulatory Agencies like the U.S. Bureau of Economic Analysis (BEA) and the U.S. Federal Reserve provide economic and fin information
  • Central bank's public information including inflation rates, money supply, foreign exchange rates, etc.
  • Open data platforms: organizations like the World Bank offer open data, which means it's freely accessible to the public
  • APIs and Data Feeds: Many platforms like Finage offer App Programming Interfaces or Widgets that allow users to access or integrate data into their systems

Types of data

Whether the data is free to use depends on the source. Yes, some are free, especially from government agencies. Some are paid, especially if you use premium services with real-time feeds. They often come with a price. Common types include:

  • Market data: stock prices, indices, commodity prices, exchange rates, bond yields, options.
  • Company financials: balance sheets, income statements, cash flow statements, and other financial metrics for public companies.
  • Economic indicators: GDP growth rates, unemployment rates, inflation rates, consumer confidence indices, and more.
  • Credit and debt: interest rates, credit spreads, credit default swap (CDS) prices, and information related to bond markets.
  • Alternative data: non-traditional data sources like social media sentiment, satellite imagery, crypto data, and web scraping are used to gain insights into financial markets and trends.
  • Real-time and historical data: it provides context and allows trend analysis right now and over time.


Remember that while using financial data, it's crucial to be aware of data accuracy, potential biases, terms of use, etc.

Categories and using API

So accessing data involves several approaches. First, you need to define your specific requirements and strategy. Further, you have to choose a methodology that aligns with the needs. While information about subjects is readily available, you can create an application by partnering with professional market feed providers with specific services that will help you acquire data at the proper time.


You can also access data sets through APIs and WebSockets. By registering at the trading platforms, you can quickly receive your API key and WebSocket address. The accompanying documentation simplifies the process of implementing these solutions into your software, code, or platform whatever you choose.


The data can also come from numerous sources, some of which offer datasets for free, while others may require payment. Generally, limited and delayed APIs can provide free financial data from providers like Finage. You can also get a no-cost API key that allows you to swiftly integrate financial data into your projects.


Currently, the world boasts over 300K symbols, and while obtaining all available data might not be necessary for everyone, selecting the market data relevant to your project is crucial. The primary categories of financial data include:

- Stocks: US, Euro, Asia, and the rest of the world

- Forex: currencies, commodities, metals, minerals, and oil from different countries

- Crypto: 1000s of cryptocurrencies, their prices, volumes, historical data

- Indices: US100, UK100 and GER30

- ETFs: tradable investment assets similar to mutual funds

- Financial Statements: structured records presenting financial activities and status

Final thoughts

Understanding the distinction between different data like real-time and delayed is crucial. For example, you can get tick-level basis updates, reflecting trades as they occur, primarily delivered via WebSocket or you can get information with a delay of minutes to hours, often it’s used for informative purposes on newspapers or sites, boasting lower exchange display costs.


It is crucial to get distinct connection methods to access market feeds and acquire a continuous stream of information. In contrast, APIs work based on request and response mechanisms, commonly used for historical data retrieval. Financial data finds diverse usage across numerous fields from Algorithmic Trading and Company Evaluations (M&A) to Smart Contracts and Digital Banks. It is pivotal for people and organizations venturing into the fintech and SAAS startup space as well. So enabling the realization of innovative ideas and concepts is based on the usage of fundamental data, especially in the trading market.


You can get your Real-Time and Historical Market Data with Finage free API key.

Build with us today!

Start Free Trial

Share article

linkedinXFacebookInstagram
Financial Data Trading and Financial Data Importance of Financial Data in Trading Trading Strategies and Financial Data Data Analysis in Trading Financial Data for Traders Utilizing Financial Data Types of Financial Data Real-Time Financial Data Historical Financial Data Trading Decisions and Financial Data Role of Financial Data in Trading Financial Data Interpretation Data-driven Trading Trading Efficiency with Financial Data Incorporating Financial Data in Strategies Financial Data for Risk Assessment Financial Data Impact on Markets Trading and Market Data Pivotal Role of Financial Data

Claim Your Free API Key Today

Access stock, forex and crypto market data with a free API key—no credit card required.

Logo Pattern Desktop

Stay Informed, Stay Ahead

Finage Blog: Data-Driven Insights & Ideas

Discover company news, announcements, updates, guides and more
Finage Logo
TwitterLinkedInInstagramGitHubYouTubeEmail
Finage is a financial market data and software provider. We do not offer financial or investment advice, manage customer funds, or facilitate trading or financial transactions. Please note that all data provided under Finage and on this website, including the prices displayed on the ticker and charts pages, are not necessarily real-time or accurate. They are strictly intended for informational purposes and should not be relied upon for investing or trading decisions. Redistribution of the information displayed on or provided by Finage is strictly prohibited. Please be aware that the data types offered are not sourced directly or indirectly from any exchanges, but rather from over-the-counter, peer-to-peer, and market makers. Therefore, the prices may not be accurate and could differ from the actual market prices. We want to emphasize that we are not liable for any trading or investing losses that you may incur. By using the data, charts, or any related information, you accept all responsibility for any risks involved. Finage will not accept any liability for losses or damages arising from the use of our data or related services. By accessing our website or using our services, all users/visitors are deemed to have accepted these conditions.
Finage LTD 2025 © Copyright