Products

Charts

Resources

Products

Charts

Resources

Back to Blog

by Finage at April 11, 2022 4 MIN READ

Stocks

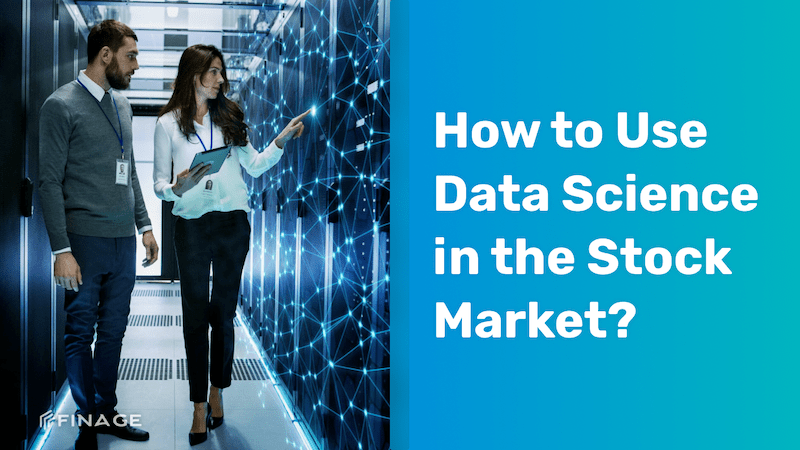
How to Use Data Science in the Stock Market?


Data Science is a popular subject today. Everyone is all about data. What it can do and how it can help. Many times, data is represented by numbers, and these numbers can represent many different things. These numbers can be sales, inventory, consumers, and last but certainly not least - cash.


This brings us to financial data, specifically the stock market. Stocks, commodities, securities, and the like are very similar when it comes to trading. We buy, we sell, we keep. All this to make a profit. 


What is Data Science?

Data science brings together many fields, including statistics, scientific methods, artificial intelligence (AI), and data analysis to extract value from data. People who deal with data science are called data scientists. They combine a range of skills to analyze and generate actionable insights from data collected from the web, smartphones, customers, sensors, and other sources.


data science; includes preparing data for analysis, including cleaning, aggregation, and processing to make it suitable for advanced data analysis. Analytical applications and data scientists can then review the results to uncover patterns and enable business leaders to gain informed insights.


Advantages Of the Data Science Platform

The data science platform allows teams to share code, results, and reports, reducing duplication and driving innovation. Eliminates workflow bottlenecks by simplifying management and incorporating best practices.


In general, the best data science platforms target:


  • Making data scientists more productive by helping them accelerate and deliver models faster and with fewer errors
  • Making it easy for data scientists to work with large volumes of diverse data
  • Providing reliable, enterprise-grade AI that is unbiased, auditable, and reproducible


Data Science Concepts for Stock Market

When it comes to Data Science, a large number of words and phrases or jargon are used that many are unfamiliar with. We are here to solve all this. Data science naturally includes knowledge of statistics, mathematics, and programming. If you're interested in learning more about these concepts, I'll link some resources throughout the article.


Now to what we all want to know, let's use data science to analyze the market. With analysis, we determine which stock is worth the investment or not. Let's explain some data science concepts centered on finance and the stock market.


Algorithms

Algorithms are widely used in data science and programming. An algorithm is a set of rules used to perform a specific task. You may have heard that algorithmic trading is popular in the stock market. Algorithmic trading uses trading algorithms and these algorithms include rules such as buying a stock only after it has dropped exactly 5% that day or selling if the stock has lost 10% of its value when it was first purchased.


All of these algorithms can work without human intervention. Because they are mechanical in their trading methods and trade emotionless, they are often referred to as trading bots.


Education

This is not your typical training. With data science and machine learning, training involves using selected data or some of the data to "train" a machine learning model. The entire dataset is usually split into two different sections for training and testing. This split is typically 80% of the entire dataset organized for 80/20 training. This data is called training data or training set. For the machine learning model to make accurate predictions, it must learn from historical data (training set).


Testing

After training a model with the training set, we would like to know how well our model is performing. This is where the other 20% of the data comes in. This data is often called test data or test set. To validate our model's performance, we would take our model's predictions and compare them to our test set.


For example, suppose we train a model on stock price data for one year. We will use January through October prices as our training set, and November and December will be our test set (this is an extremely simple example of dividing annual data and should not normally be used for seasonality and similar reasons). After training our model on January-October prices, we will forecast it for the next two months. These estimates will then be compared to actual prices from November and December. The amount of error between estimates and actual data is what we aim to reduce when dealing with our model.


Final Thoughts 

The topics we cover are common core data science and machine learning concepts. These topics and concepts are important for learning data science. There are many more concepts to consider here. If you are familiar with the stock market and have an interest in data science, we hope these definitions and examples are helpful and understandable.


We hope that this blog post will be beneficial for you. We will continue to create useful works to get inspired by everyone. We are sure that we will achieve splendid things altogether. Keep on following Finage for the best and more.


You can get your Real-Time and Historical Stock Data with Finage free Stock Data API key.

Build with us today!

Start Free Trial

Back to Blog

Request a consultation

Blog

Top Decentralized Solutions to Build the Future of Finance

The financial and trading sectors are going through a transformation like never seen before. With the latest innovations now available, it is easy to understand why so many are turning to new tools and solutions to improve services. Additionally, you can mention that the development of Decentraliz

Green Finance: Supporting Sustainable Development

Green finance, a crucial element in the worldwide push for sustainable development, revolves around investments in projects and technologies that yield positive environmental outcomes. This burgeoning financial sector plays a pivotal role in supporting initiatives dedicated to combatting climate c

Read more

Please note that all data provided under Finage and on this website, including the prices displayed on the ticker and charts pages, are not necessarily real-time or accurate. They are strictly intended for informational purposes and should not be relied upon for investing or trading decisions. Redistribution of the information displayed on or provided by Finage is strictly prohibited. Please be aware that the data types offered are not sourced directly or indirectly from any exchanges, but rather from over-the-counter, peer-to-peer, and market makers. Therefore, the prices may not be accurate and could differ from the actual market prices. We want to emphasize that we are not liable for any trading or investing losses that you may incur. By using the data, charts, or any related information, you accept all responsibility for any risks involved. Finage will not accept any liability for losses or damages arising from the use of our data or related services. By accessing our website or using our services, all users/visitors are deemed to have accepted these conditions.

Finage LTD 2024

Copyright