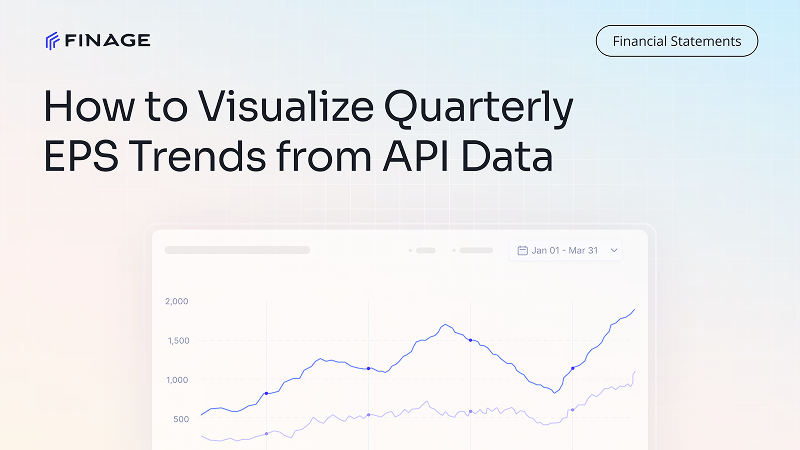
Earnings per share (EPS) is one of the most closely followed indicators in equity analysis, as it directly reflects a company’s profitability and shareholder value. For traders, analysts, and fintech teams, understanding how EPS evolves is critical, not just in absolute numbers, but in trends that reveal growth consistency or risk signals. This is where an EPS trend API becomes valuable. By turning quarterly earnings data into structured, real-time feeds, it becomes easier to track, compare, and visualize EPS across companies and sectors.
Finage provides reliable APIs that simplify this process, offering both real-time and historical EPS datasets that can be integrated into dashboards, applications, and trading systems. This blog explores why visualizing EPS trends matters, how APIs streamline access, and how teams can apply these insights to build better strategies.
- Why EPS Trends Matter in Market Analysis
- Understanding the Basics of Quarterly EPS Data
- Challenges in Tracking EPS Trends Manually
- How an EPS Trend API Simplifies the Process
- Visualizing EPS Data for Smarter Decisions
- Real-Time vs. Historical EPS Insights
- How Finage Powers EPS Trend Tracking
- Final Thoughts
Earnings per share (EPS) is more than just a quarterly figure; it’s a direct reflection of how effectively a company generates profit for its shareholders. While one strong quarter can create excitement, it’s the trend in EPS that provides real insight into long-term performance. An EPS trend API helps traders and analysts capture these developments consistently.
Tracking EPS over multiple quarters highlights whether a company is consistently growing, plateauing, or facing decline. This context is essential for separating sustainable growth from short-term spikes.
Analysts and investors closely compare reported EPS against estimates. A positive or negative surprise often moves stock prices sharply, but recurring beats or misses form the real narrative.
A weakening EPS trend may indicate underlying operational challenges, while steady growth strengthens valuation multiples and investor confidence.
By visualizing EPS trends across companies within the same industry, traders gain a better sense of relative performance and sector momentum.
In short, EPS trends guide smarter investment decisions by showing not just where a company is today, but where it is heading.
Before visualizing earnings effectively, it’s important to understand what quarterly EPS data represents and why consistency matters. An EPS trend API provides this data in a structured format, but context is key for interpretation.
EPS is calculated by dividing a company’s net income by its outstanding shares. It shows how much profit each share of stock generates in a given period.
Most companies report EPS every quarter, aligning with financial disclosures. These quarterly updates provide timely insights into business performance and market positioning.
Companies often report both GAAP (Generally Accepted Accounting Principles) EPS and adjusted EPS. Adjusted figures exclude one-time items, giving a clearer view of ongoing profitability.
While a single quarter can move markets, trends across multiple quarters reveal the real story, sustained growth, cyclicality, or potential decline.
Understanding these basics ensures that when data flows through an EPS trend API, traders and fintech teams can interpret it with precision.
While quarterly EPS data is widely available, manually collecting and organizing it poses significant hurdles. This is why many traders and fintech teams turn to an EPS trend API to automate the process.
EPS reports are spread across earnings releases, regulatory filings, and financial news sources. Manually consolidating this data is time-consuming and prone to errors.
Markets move quickly when earnings are announced. Relying on manual updates means traders often react too late to capitalize on surprises.
Different companies and reporting platforms use varying formats. Without normalization, comparing EPS across firms or sectors becomes inefficient.
Gathering multiple quarters or years of EPS data manually requires extensive effort, making backtesting or trend analysis difficult.
Manual entry increases the risk of inaccuracies, which can lead to flawed conclusions and trading mistakes.
By addressing these challenges, an EPS trend API streamlines access to clean, consistent, and timely earnings data.
An EPS trend API transforms the way traders, analysts, and fintech platforms access and interpret earnings data. Instead of chasing scattered reports, APIs deliver structured, reliable insights that can be used instantly.
With one API endpoint, users can pull quarterly EPS data across multiple companies, eliminating the need to track separate reports.
APIs normalize data into consistent structures such as JSON, making it easier to integrate into dashboards, trading systems, or research tools.
As soon as companies release earnings, APIs can push the new data directly to applications, allowing traders to react faster than manual tracking ever could.
Most APIs include years of historical EPS data, enabling teams to build trend visualizations and backtest strategies with accuracy.
With REST and WebSocket support, EPS trend APIs can be integrated into diverse platforms, from mobile apps to enterprise-grade analytics systems.
By removing friction from the data-gathering process, APIs let market participants focus on interpreting EPS trends instead of collecting them.
Once the EPS data is structured and accessible through an EPS trend API, the next step is visualization. Turning raw numbers into clear charts makes it easier to spot performance patterns and market signals.
Plotting EPS values quarter by quarter highlights growth consistency, sudden drops, or cyclical behaviors. This simple view helps traders assess momentum.
Visualizing EPS against the same quarter in prior years filters out seasonal effects and reveals whether earnings are truly improving.
By comparing EPS trends of multiple companies in the same sector, analysts can identify market leaders, laggards, and emerging opportunities.
Visualizing actual EPS against analyst estimates shows how often a company beats or misses expectations, helping to forecast future volatility.
APIs make it easy to embed visualizations directly into trading platforms, giving instant context during earnings season.
With effective visualization, EPS trend data shifts from static reports to actionable insights for decision-making.
To fully leverage earnings data, traders and fintech teams need both immediate updates and long-term context. An EPS trend API that delivers real-time and historical datasets provides the complete picture.
APIs push earnings updates as soon as they are released, allowing traders to react instantly to surprises, either capitalizing on volatility or adjusting risk exposure.
Looking back at years of EPS data reveals performance cycles, growth consistency, and how companies respond to economic shifts. This context strengthens both analysis and strategy building.
Combining live and historical data makes it possible to evaluate whether a strong quarter is part of a sustainable trend or just a short-term spike.
Historical EPS datasets enable analysts to test trading models against past earnings reactions, improving confidence in future strategies.
Together, real-time feeds and historical continuity ensure that EPS tracking supports both tactical decisions and long-term investment insights.
Finage offers the infrastructure that traders, developers, and fintech teams need to track earnings with precision. Its EPS trend API is designed to deliver clean, fast, and reliable earnings data in a developer-friendly format.
Finage streams EPS results as soon as they are released, giving traders the speed advantage needed during earnings season.
With access to years of historical data, analysts can build long-term earnings trend charts, run comparisons across sectors, and backtest strategies.
Finage normalizes EPS data across companies, eliminating formatting issues and making integration seamless for dashboards and trading systems.
Beyond EPS, Finage provides financial data across equities, forex, crypto, and ETFs, enabling cross-market insights from a single API source.
With REST endpoints, WebSocket support, and clear documentation, Finage simplifies integration for both small-scale projects and enterprise-grade fintech platforms.
By combining speed, depth, and reliability, Finage makes EPS trend tracking both scalable and actionable.
Quarterly EPS figures are vital snapshots of company performance, but it’s the long-term trend that tells the real story. Tracking these shifts requires structured, timely, and consistent data delivery, something manual methods can’t provide. With an EPS trend API, traders, analysts, and fintech teams can move beyond fragmented reports, turning earnings data into visual insights that drive smarter strategies.
Real-time updates ensure no earnings surprise goes unnoticed, while historical datasets provide the depth needed for backtesting and long-term comparisons. When combined, they empower market participants to balance immediate reactions with strategic planning.
Finage makes this process seamless with its EPS trend API, offering standardized, developer-friendly access to both real-time and historical earnings data. Whether you’re building visual dashboards, running sector-wide comparisons, or powering automated trading systems, Finage equips you with the tools to turn EPS data into a competitive advantage.
Start your free trial with Finage today and bring clarity to earnings season.
Access stock, forex and crypto market data with a free API key—no credit card required.
Discover company news, announcements, updates, guides and more