Back to Blog
by Finage at January 4, 2023 • 9 MIN READ
Real-Time Data
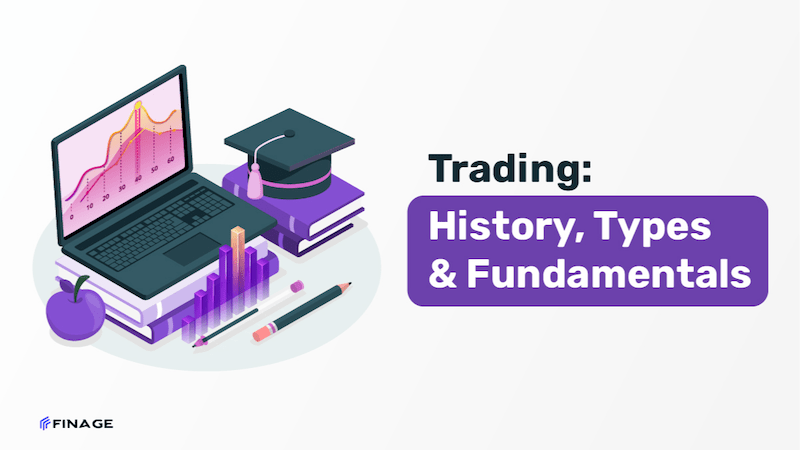
Trading, at its core, is a risky business and there is a lot more to it than meets the eye. On a basic level, it describes the buying and selling of stock to make a profit. The type of this model followed by most people is the buying of stock and holding it in the hopes that its value will rise. This version is most similar to trading on fundamentals which focuses mainly on an organization's events to plot the best moment to engage in any activity.
As you can see, over the years things have changed in the niche from the basics of stock bartering to crypto trading. As far back as civilization has existed, the idea of trading has been actually there. Trading in stocks in itself is a wide topic that encompasses quite a bit, as it has been around for decades at this point. During this time, it has evolved to its current state but has still managed to keep all the major fundamentals. So let’s get a bit of a crash course on what trading is, how it has come to be as it is, and see the multiple ways in which you can go about it!
- Quick history outlook
- Venice period
- Belgium brokers
- East India period
- The Modern Stock Markets
- Stock trading types
- Technical
- Fundamental
- Scalping
- Momentum
- Swing trading
- Fundamentals of trading
- The meeting of goals and predictions
- Upgrades and downgrades
- Takeovers and related actions
- The stock split
- Final thoughts
Trading in the general sense has been around for millennia from Ancient times to the Middle ages, but when you throw in the idea of stocks, the history is not as deep, but equally as fascinating. If you want to trace it back, you can look at the development of the stock concept into the following parts:
- Venetians of the 1300s
- Belgians of the early 1530s
- East Indian Companies of the 1600s
- England period
- A brief history of Wall Street
- Modern trading from 1773 till the present
Trading undoubtedly requires a major scanning of every period. Let’s take a look at the most interesting periods, at the earlier trading and its prominent events.
To begin with, the concept of stocks thrived a long time before even before the origin of this story. It can all be traced back to the 1300s when the Venetian elite took it upon themselves to take the place of banks that couldn't keep up with the money lending. Soon after the trading of debts followed, this would eventually evolve into the trading of securities among European governments.
This was something that typically took place in Antwerp and was a larger-scale version of what the Venetians did. Of course, stocks, as we know them, didn't exist. Instead, a promissory note for a bond would be used for brokers to properly trade.
It was a time of promissory bonds. Lots of companies and business pros started partnerships to make a profit with stocks. Sure, there were no official shares.
This is where things take a turn as almost all European companies on the high seas started using investments to protect against the risk of lost ships. In doing so, the first limited liability companies were formed. This led to the creation of the dividend to pay out to investors. Here, the England East India affair has gained one of the most competitive advantages in the financial industry — a government-backed monopoly.
All the above-represented additions to the overall concept of the stock exchange led to the creation of the London stock market in 1773. Shortly after, the likes of the Philadelphia and New York stock markets followed. The New York Stock Market and the UK-US relationship periods take a big part in history.
They have relatively few restrictions, especially when compared to the lesser versions like the English coffee houses. All this has led to the modern day which has renowned stock exchanges such as:
- FTSE 100
- Hong Kong Stock Market
- Tokyo Stock Market
Because of how trading evolved over the centuries, many different strategies have been created to help traders gain an edge in the market. In today's world, there are many tactics used, but five of these stand out above the rest and they are as follows:
This style focuses on the use of data that is found on graphs and charts. From these, a trader can find certain indicators that will inform them whether to buy or sell.
Trading this way depends completely on the state of a stock's source company. In particular, certain events will determine how valuable stock will be and these include the likes of:
- Acquisitions
- Reorganizations
- Stock splits
This style requires that a trader make as many trades as possible at the same time. This is done in order to have as many little profits across the board. The scalpers as they are called, then gain an overall profit if all goes well.
This method bases itself on the constant swelling of stock value that the market has. If a certain company's stock appears to be on the rise, a trader using this method will just ride the wave until the downward trend.
Swing trading is actually quite similar to its fundamental counterpart. What sets it apart is the fact that positions are kept for a longer period of time. As a matter of fact, most fundamental traders are just swing trading as the long game can be more profitable in given situations.
Just to get this out of the way, you should not mistake this for fundamental trading. Instead, trading is the thing you should always keep in mind before making a decision. If you are to narrow it down, there are three trading fundamentals that should always be observed and they are:
1-) Proper timing ― unlike simply investing in a business, trading is very much on a short-term basis. Because the market is always volatile, you as a trader should time your buying and selling of positions as perfectly as possible.
2-) Educated assessment ― as stated earlier, the market is pretty chaotic and even if you time a trade perfectly, it has to be right. As such every aspect of the stock has to be analyzed carefully before any decision is made.
3-) Conservative trading ― a healthy amount of respect has to be given to this field because it can lead to heavy losses. The best way of doing that, especially for newer traders, is to set limits for themselves. By doing this, the likelihood that losses will reduce.
One of the best things about fundamental trading is that it uses tangible results to make educated decisions. By analyzing a company's balance sheet, for example, you can get a pot of information such as:
- both kinds of financial ratios
- cash flow
- revenue
- earnings per share
Because this type of data communicates how a company is doing, it is particularly useful to traders. That said, trading is a competitive field, so it's safe to assume that if you are trying to find an edge through this information, someone else is trying to do the same thing.
Every company trying to go public or that is already there will have meetings known as earnings announcements. In these meetings, all the company's future earnings projections will be discussed.
Traders usually make their moves after said meetings, based on what they hear. This way of going about it is perfect for those who like the short-term game, but competition is ever-present.
Often, those with a lot of experience in this world will have their eyes always looking for the latest trends. So, when an analyst gives a certain stock an upgrade or downgrade, the markets will react accordingly with the latter in particular, showing that it's probably time to short-sell. This short-term nature makes it very similar to earnings announcements because they rely on sudden movements in the market.
In the corporate world, companies are always on the move internally and any slight movement can cause a company's stock to rise or fall. Price fluctuations usually surround a company when any of the following occur:
- takeovers
- acquisitions and
- reorganizations
What's interesting about this particular area is that it is rather difficult to predict anything. When these events occur, a lot of wondering about the future follows and as a result, the stock value is likely to rise.
During this tension-filled phase, art traders typically buy as much as they can only to hold for as long as necessary. When some certainty is established right after all these events have been sorted out, smart traders would have already sold their shares, because stock prices generally drop after anything new is brought forward.
With all that out of the way, you need to know that it may not always work out this way. Such is the risk of waiting for these particular events to pass. Speculation can't always be relied upon. The complete opposite may happen and this is why using as many indicators as you can is more than advised. The reasons for this can be as mundane as a simple dislike of a new CEO.
Oftentimes, companies will try to increase the number of shares they possess without affecting market capitalization. This is what is known as a stock split and though the market capitalization doesn't change, the idea is that the stock is being split into multiple different shares, with each of them being a fraction of the initial price. When it comes to trading, there is a chance that buying them may lead to profits for all parties when there is an upwards swing in momentum.
To best understand how to trade using this method, you have to:
- figure out when these splits are most likely to happen;
- certain events such as the ones listed above will lead to changes in a stock's price;
- in such a moment, a knowledgeable trader will seek out this short-term opportunity;
- use the opportunity to buy the stock just before it splits.
Despite all this, the moments after the splits are most likely to experience a downturn in price and are, therefore, the best times to sell.
You need to know that there are many ways in which one can achieve the profit one wants. What any new trader should remember is that they should experiment to an extent. After a while, their best bet is to choose one direction based on their skill set and level of comfort.
The evolution of the stock exchange can be looked at as quite an achievement, with multiple different pieces added every generation or so. All this building has laid out a blueprint that has given us the modern-day stock exchange which has also evolved with the creation and implementation of different strategies.
With the proper strategies, the innovative minds in the financial world have created various pieces of technology that allow the creation of profit to happen instantly, for example, you can use bots, historical and real-time data, API, or AI tech to predict future data. That said, all the above information can help make trading easier.
You can get your Real-Time and Historical Market Data with Finage free API key.
Build with us today!
Featured Posts
Gamifying Finance: Fantasy Trading and Web3
December 17, 2024
What Are the Key Macroeconomic Indicators to Watch?
December 16, 2024
What Is an Initial Public Offering (IPO) & Its Trends?
December 15, 2024
Why Token Liquidity is a Key Metric for DeFi Investors
December 14, 2024
From Arbitrage to Hedging: How DEX Data Transforms Crypto Trading
December 13, 2024
Tags
Trading History
Trading Terms
Stock Markets
Finage Stock Data APIs
Stock WebSocket
Stock Data WebSocket
Stock Market Data APIs Feeds
Join Us
You can test all data feeds today!
Start Free Trial
If you need more information about data feeds, feel free to ask our team.
Request Consultation
Back to Blog
Please note that all data provided under Finage and on this website, including the prices displayed on the ticker and charts pages, are not necessarily real-time or accurate. They are strictly intended for informational purposes and should not be relied upon for investing or trading decisions. Redistribution of the information displayed on or provided by Finage is strictly prohibited. Please be aware that the data types offered are not sourced directly or indirectly from any exchanges, but rather from over-the-counter, peer-to-peer, and market makers. Therefore, the prices may not be accurate and could differ from the actual market prices. We want to emphasize that we are not liable for any trading or investing losses that you may incur. By using the data, charts, or any related information, you accept all responsibility for any risks involved. Finage will not accept any liability for losses or damages arising from the use of our data or related services. By accessing our website or using our services, all users/visitors are deemed to have accepted these conditions.