Products

Charts

Resources

Products

Charts

Resources

Back to Blog

by Finage at December 12, 2021 7 MIN READ

Stocks

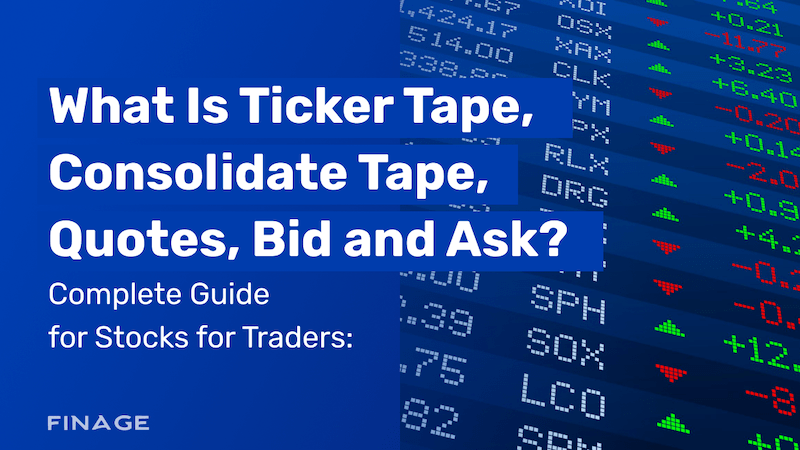
What Is Ticker Tape, Consolidate Tape, Quotes, Bid and Ask? Complete Guide for Stocks for Traders.


Table of Contents

What Is Ticker Tape?

Consolidated Tape

Quoted Price

What Is Bid and Ask?


What Is Ticker Tape?

Ticker tape is one of the earliest mediums designed for electrical communications related to finance. Between 1870 and 1970 it was used to transmit stock prices via the telegraph wiring system. The registration tape system consisted of a paper strip running over a machine name stock register. This machine was printing the abbreviated/abbreviated names of the companies. This was followed by stock trading price and volume, among other things. The machine was making a 'tick' sound and this is why the entire setup is called a slip band. 

Stock machines are a precursor to today's computer presses. Ticker tape is a pioneering application invented to transmit text messages via a cable to a print installation. The idea of the ticker tape is based on the printing telegraph. The technology used in the recording tape was that of the then newly modelled telegraph setup. The telegraph machine could produce the dots and lines of Morse code, while the tape machine was capable of producing a readable output text. A custom-built typewriter was designed to run over telegraph cables and was used at the opposite end of the telegraph cables leading to the telegraph wiring machine.


Ticker Tape History

The first telegraph tape was created by Edward Calahan in 1867, and Thomas Edison improved on Calahan's invention and patented it in 1871. 1 Much of the technology underlying the original ribbon-to-strip system was based on telegraph wires. The original systems used special keyboards that converted stock data into morse code and then machine-read at the other end.

Introduced in 1930 and 1964, scroll tape machines were twice as fast as their predecessors, but still had a delay of about 15-20 minutes between the time of an operation and the time it was recorded. In the 1960s, mechanical tapes were replaced by electronic ones. In the late 19th century, most brokers trading on the kept a steady supply of tapes and an office nearby to make sure their stocks were getting the latest trading figures. A real-time electronic exchange was not launched until 1996. These current transaction figures, namely price and volume, appear on TV news programs, financial channels and websites today.


Consolidated Tape

The "consolidated band" is a high-speed, electronic system that reports the latest price and volume data on the sale of listed stocks. Consolidated tape data is generated by broker-dealer's trading on various market centres and exchanges, including all National Stock Exchanges and Alternative Trading Systems. Websites that provide updated market information and financial news programs on television often include commercial reports on tape.


History of Consolidated Tape and Ticker Tape

The consolidated band comes from the term ticker band. While the tape is digital today, the paper tape got its name from the clicking sound emitted by the mechanical machine that originally printed long strips of paper at stock prices. These mechanical ribbon tapes gave way to electronic ones in the 1960s. The consolidated tape was introduced in 1976.


The first telegraph ticker tape was created by Edward Calahan in 1867, the great American inventor Thomas Edison modified it and patented it in 1871 by developing it to its original design in 1871. Most brokers' offices traded,  in the 19th century to ensure that most brokers' offices were constantly supplying tape and getting the latest trading figures for stocks. Messengers, or pad shovers, relayed these offers by running a circuit between the trading floor and the brokers' offices. The shorter the distance between the trading area and the brokerage house, the more up-to-date the offers were.


Quoted Price

A quoted price is the most recent price at which an investment (or any other type of asset) was traded. The quoted price of investments such as stocks, bonds, commodities and derivatives constantly changes throughout the day as events occur that affect the financial markets and the perceived value of various investments. The quoted price represents the final bid and selling prices that buyers and sellers can agree on.


Understanding a Quote

The quoted prices of the stocks are displayed in an electronic ribbon band showing the most up-to-date information on the trading price and trading volume. Trading hours for most major exchanges are between 9:30 am and 4:00 pm EST. The registration tape shows the stock (denoted by the three- or four-letter ticker symbol or ticker symbol - for example, AAPL for Apple Inc. or TGT for Target Corporation), the number of shares traded, the price at which it is traded whether the quoted price represents an increase or decrease from the last quoted price, and the amount of the change in price.

When people trade their portfolios, the prices quoted are usually displayed in a rectangle anywhere in their online trading platform in an easy-to-place place. If the security is in high demand and trading in large volumes, offers and solicitations are constantly moving. If the security is not well received and has no significant demand, the quoted price may not move up or down much during the trading day.


What Is Bid and Ask?

The term "bid and demand" refers to a two-way bid that shows the best potential price at which a security can be sold and bought at a given time. The bid price represents the maximum price a buyer is willing to pay for a stock or other security. The selling price represents the minimum price a seller is willing to charge for the same security. A trade or transaction occurs when a buyer in the market is willing to pay the best available bid or sell at the highest bid. Understanding and Asking the Offer

The average investor struggles with the bid and wants the spread as an implied trading cost. For example, ABC Corp. If the current bid for the stock is $10.50 / $10.55, investor X who wants to buy A at the current market price will pay $10.55, while investor Y who wants to sell ABC shares will pay $10.55. The current market price would be $10.50.


Who Benefits from the Purchase-Inquiry Difference?

The buy-spread works in favour of the market maker. Continuing with the example above, a market maker bidding $10.50 / $10.55 for ABC stock states that he is willing to buy A at $10.50 (buy price) and sell at $10.55 (ask price). The spread represents the profit of the market maker.


Bid-ask spreads can vary widely depending on security and market. The premium companies that make up the Dow Jones Industrial Average may have a bid-to-sell range of only a few cents, while a small-cap stock trading less than 10,000 shares a day may have a bid-to-sell range of 50 cents or more. In times of illiquidity or market turmoil, the bid-ask margin can expand considerably, as traders will not be willing to pay a price beyond a certain threshold and sellers will not be willing to accept prices below a certain level.


What is the Difference between Buying Price and Selling Price?

Bid prices refer to the highest price that traders are willing to pay for a security. The selling price is the lowest price at which the holders of that security are ready to sell it. For example, if a stock is trading at an asking price of $20, a person who wants to buy that stock must offer at least $20 to buy it at today's price. The gap between the bid and ask prices is often referred to as the bid-ask spread.


What Does It Mean When Offer and Demand Are Close Together?

When the bid and ask prices are very close, it usually means there is plenty of liquidity in the security. In this scenario, the security is said to have a "narrow" bid-ask spread. This can be beneficial for traders, especially when it comes to large positions, as it makes it easier to enter or exit their positions.


How Are Buying and Selling Prices Determined?

Buying and selling prices are determined by the market. In particular, it is determined by the actual buying and selling decisions of the people and institutions investing in that security. If demand exceeds supply, the buying and selling prices will gradually shift upwards. Conversely, if supply exceeds demand, the buying and selling prices will drag down. The difference between the bid and ask prices is determined by the overall level of trading activity in the security, and higher activity leads to narrow bid-ask spreads and vice versa.

We hope that this blog post will be beneficial for you. We will continue to create useful works in order to get inspired by everyone. We are sure that we will achieve splendid things altogether. Keep on following Finage for the best and more.


You can get your Real-Time and Historical Tick Data with Finage Tick Level Basis APIs and WebSockets.

Build with us today!

Start Free Trial

Back to Blog

Request a consultation

Blog

How to Use WebSocket for Real-Time Financial Data: Benefits and Implementation Guide

In the competitive landscape of financial trading, access to real-time data is paramount. Traders, investors, and financial platforms all depend on the ability to get immediate updates on market conditions to make timely and well-informed decisions. While traditional HTTP APIs have served this pur

Predicting Market Trends Using Quantum Finance

The financial market is notoriously volatile and navigating it requires innovation and a suitable toolkit. The use of something like a Historical data market API is a way of going about it and with AI coming into the fray, the ability to not only make predictions but analyze data has only increase

Read more

Please note that all data provided under Finage and on this website, including the prices displayed on the ticker and charts pages, are not necessarily real-time or accurate. They are strictly intended for informational purposes and should not be relied upon for investing or trading decisions. Redistribution of the information displayed on or provided by Finage is strictly prohibited. Please be aware that the data types offered are not sourced directly or indirectly from any exchanges, but rather from over-the-counter, peer-to-peer, and market makers. Therefore, the prices may not be accurate and could differ from the actual market prices. We want to emphasize that we are not liable for any trading or investing losses that you may incur. By using the data, charts, or any related information, you accept all responsibility for any risks involved. Finage will not accept any liability for losses or damages arising from the use of our data or related services. By accessing our website or using our services, all users/visitors are deemed to have accepted these conditions.

Finage LTD 2024

Copyright