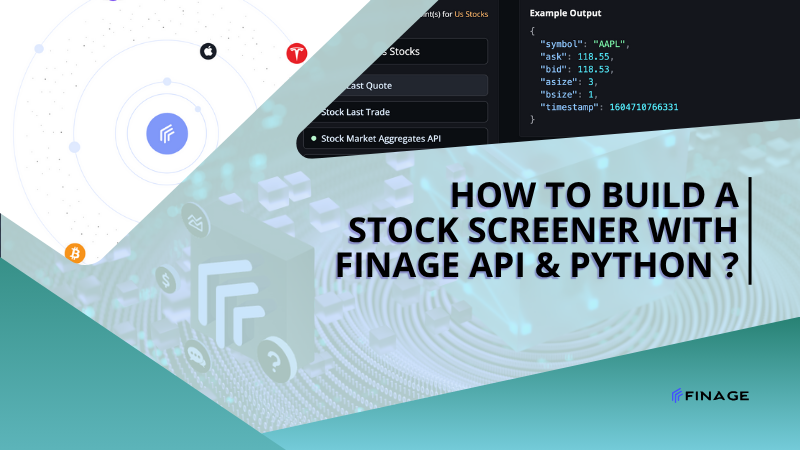
How to Build a Stock Screener with Finage API & Python
9 min read • June 25, 2025

Introduction
Stock screeners are essential tools for traders, investors, and financial analysts. They help surface opportunities by filtering stocks based on metrics like price, volume, market cap, volatility, or custom conditions. And thanks to powerful data platforms like Finage, you don’t need a Bloomberg Terminal to build one.
In this post, we’ll walk through how to create a stock screener using Python and Finage’s real-time and historical API endpoints. We’ll cover the logic behind screening, how to access and filter market data using Finage’s stock API, and how to return meaningful results based on custom criteria.
By the end, you’ll have the foundation to build your own screener—customized to your strategy, automated, and fast enough to run live in production.
Curious what makes a stock screener effective? Here’s how institutional investors apply screening to discover under-the-radar assets.
Table of Contents
- Understanding the Purpose of a Stock Screener
- Choosing the Right Data Metrics
- Setting Up Finage API Access in Python
- Filtering Stocks with Custom Rules
- Displaying and Exporting Screener Results
- Challenges in Live Screening
- How Finage Makes This Easier
- Final Thoughts and Next Steps
1. Understanding the Purpose of a Stock Screener
At its core, a stock screener is a tool that helps filter the noise. With thousands of publicly traded companies across global exchanges, it’s nearly impossible to manually track every opportunity. A screener lets you narrow the field based on specific criteria, so you can focus only on the stocks that meet your investment or trading goals.
Some investors use screeners to find undervalued stocks based on price-to-earnings ratios or earnings growth. Others look for short-term technical setups—like high volume breakouts or volatility spikes. Regardless of the strategy, the value of a screener comes from its ability to surface signals while ignoring irrelevant data.
A good stock screener is both flexible and fast. It should allow users to:
- Define custom filters, including multiple data points
- Pull current and historical data as needed
- Update results in real time or on demand
- Work at scale without delays, whether analyzing 100 symbols or 5,000
When you're building your own, these are the qualities to aim for. And with the right tools—like Python and the Finage API—you can create a solution that rivals professional platforms, while still tailoring it to your unique approach.
2. Choosing the Right Data Metrics
Before you start writing any code, you need to decide what kind of data your stock screener will rely on. The most effective screeners are built around well-defined metrics that reflect a specific strategy—whether it’s value investing, momentum trading, or identifying penny stock volatility.
For example, a long-term investor might focus on fundamentals like market capitalization, dividend yield, or price-to-earnings ratio. On the other hand, a day trader may care more about real-time volume surges, intraday volatility, or price gaps.
Finage provides access to both real-time and historical data through its stock market API. You can retrieve key indicators like:
- Current and historical prices
- Volume and average daily volume
- Percentage change
- Highs and lows over custom time frames
- Open, close, and adjusted close values
It’s also possible to combine multiple datasets—for example, screening for stocks that have risen more than 3% today and are trading on unusually high volume compared to their average. These composite conditions make your screener smarter and more responsive to nuanced opportunities.
When choosing metrics, start with a simple list and expand as your strategy evolves. Try to balance usefulness with efficiency—requesting only the data you need will keep your screener fast and scalable.
If you're new to stock metrics, this guide to financial indicators is a helpful overview of what each one means and why it matters.
3. Setting Up Finage API Access in Python
To start building your stock screener, you first need to connect your Python environment to the Finage platform. The Finage API gives you access to a wide range of market data endpoints—from real-time quotes to historical price series—so choosing the right ones depends on the structure of your screener.
Authentication is handled via an API key, which you can obtain by signing up at Finage. Once you have your key, you’ll pass it in your requests to gain access to the data. You can find detailed instructions for how authentication works in the official Finage API documentation.
The data you’ll need depends on the logic of your screener. If you’re building something that filters stocks based on daily price movements, you'll likely need:
- The latest market prices for a list of symbols
- Current volume compared to historical volume
- Percent change or delta between open and close
These values can be retrieved by calling the appropriate endpoints. Finage’s API supports both single-symbol and batch queries, which allows you to work with multiple stocks efficiently. This is essential when screening large watchlists.
Once you’ve established a secure connection and confirmed that your credentials work, you're ready to move into the core logic—defining rules and filtering based on live or historical data.
Want to dig deeper into how APIs are authenticated and structured? Here's a quick overview of API key security best practices.
4. Filtering Stocks with Custom Rules
Now that your Python environment is connected to Finage and pulling in data, it’s time to define the logic behind your stock screener. This is where your strategy takes shape—whether you're looking for price breakouts, high momentum stocks, or undervalued assets.
Filtering begins by setting conditions. For example, you might screen for stocks where the daily percentage gain exceeds 4% and volume is at least twice the 30-day average. Or you may want to find stocks trading near their 52-week low, which could signal a potential reversal.
With the data retrieved from Finage’s stock market API, you can apply filtering rules like:
- Exclude stocks with low liquidity or volume
- Include only those within a specific price range
- Detect symbols where today’s open is below the 5-day moving average
- Flag stocks with unusual price movement over short intervals
This filtering is typically handled within your Python script, using conditional statements or vectorized operations if working with large symbol lists. The faster your logic, the quicker your screener can refresh results and deliver actionable insights.
Remember that your rules can be adjusted over time. Most traders refine their criteria as they gain experience or test new approaches. A good screener is one that evolves with its user—flexible enough to adapt, but consistent enough to produce meaningful results.
If you’re building rule-based systems, understanding filter chaining and boolean logic can help you avoid common pitfalls and get cleaner results.
5. Displaying and Exporting Screener Results
Once your screener logic is in place and you’ve applied your filters, the next step is to make the results easy to view and use. Whether you’re building this for personal use or integrating it into a broader platform, how you display the output matters.
Many developers begin by outputting results directly into the console or a simple dashboard. This is fine during development, but for everyday use, it's more practical to sort and format results into a clean table or structured file.
Python libraries like pandas allow you to neatly organize filtered stock data. Once you have the results, you can display them as a DataFrame, sort them by performance, or add custom flags and notes. You can also export the output to CSV, JSON, or integrate it into a dashboard that refreshes live using the Finage WebSocket API for real-time updates.
Here are a few ways to structure the final output:
- Display top 10 or top 20 matches sorted by volume or gain
- Export daily screener results for logging or backtesting
- Build a lightweight frontend that displays results with filters and tags
- Trigger alerts or webhook notifications based on matches
The presentation layer is also where you make your screener easier to use long-term. Small details—like human-readable timestamps, stock name lookups, or highlighting big movers—can turn a script into a reliable daily tool.
Want to compare frameworks? This breakdown of data visualization libraries shows the strengths of each depending on use case and complexity.
6. Challenges in Live Screening
Building a basic stock screener is relatively straightforward—but running one live, with consistent performance and accuracy, brings a new set of challenges. When data is constantly changing and decisions depend on speed, even small inefficiencies can become major problems.
The first challenge is latency. If you’re using REST APIs to pull fresh data at frequent intervals, network delays or rate limits can slow down performance. This is especially problematic during high-volume trading hours, where milliseconds matter. For better responsiveness, using the Finage WebSocket API can reduce the gap between market changes and your screener’s awareness of them.
There’s also the issue of incomplete data. Some APIs might fail to return values for certain stocks due to temporary outages or inconsistent ticker mapping. Your system should be able to handle this gracefully—skipping symbols when needed, or flagging them for later review.
Scalability becomes a concern as you expand your watchlist. Screening 50 stocks is simple; screening 5,000 requires more efficient filtering logic, tighter data handling, and memory-conscious code. Batch processing, asynchronous calls, or caching can help manage these loads.
And finally, there’s the human factor: interpretation. Not every screener hit is a good trade. Results still need to be reviewed, contextualized, and confirmed—either manually or through additional automated logic. A screener should assist decision-making, not replace it entirely.
7. How Finage Makes This Easier
Finage was built with developers, fintech teams, and active traders in mind. When building a stock screener, it’s not just about pulling data—it’s about how quickly, reliably, and flexibly that data can be accessed and used. Finage simplifies every part of the pipeline.
With its wide range of stock data APIs, you can retrieve real-time and historical prices, volume metrics, and advanced indicators with a single API key. Endpoints are well-documented, and consistent formatting means you spend less time cleaning data and more time analyzing it.
For real-time responsiveness, Finage offers WebSocket access, which allows you to subscribe to live updates for any stock in your screener. Instead of polling data repeatedly, your app receives new values the moment they change—improving both speed and resource efficiency.
Finage also supports batch requests, enabling you to query multiple symbols at once without exceeding rate limits. This is especially useful when screening large lists or comparing results across sectors. For developers scaling their tools or running screeners continuously, this functionality removes a lot of the infrastructure pressure.
And beyond technical features, Finage provides reliable uptime, global coverage, and active support—making it a strong choice whether you’re building a solo project or integrating into an enterprise-grade platform.
8. Final Thoughts and Next Steps
Building your own stock screener with Python and the Finage API unlocks a powerful advantage: customization. Instead of relying on rigid third-party tools, you can define your own logic, use the metrics that actually matter to you, and adapt your screener as your strategy evolves.
Thanks to Finage’s rich set of API and WebSocket endpoints, you’re not limited to historical queries or static data. You can track price changes in real time, respond to volume spikes, and apply layered filters with minimal delay—all from within your own Python environment.
This flexibility is especially useful for traders and developers who want to test new ideas, automate parts of their research, or simply move faster than traditional platforms allow.
If you haven’t already, you can get started by signing up at Finage, reviewing the available endpoints, and requesting an API key. From there, your screener is only a few lines of logic away.
You can get your Real-Time and Historical Stocks Data with a Stock Data API key.
Build with us today!
Claim Your Free API Key Today
Access stock, forex and crypto market data with a free API key—no credit card required.

Stay Informed, Stay Ahead
Finage Blog: Data-Driven Insights & Ideas
Discover company news, announcements, updates, guides and more


