Logo
linkedinStart Free Trial

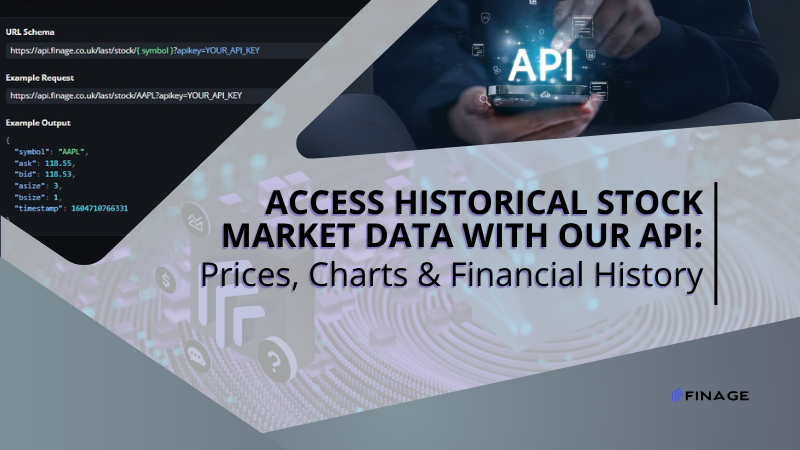
Access Historical Stock Market Data with Our API: Prices, Charts & Financial History

6 min read • July 11, 2025

Article image

Share article

linkedinXFacebookInstagram

Introduction


Historical data isn’t just for backtesting. It’s the foundation of everything from trend analysis to risk modeling and investor reporting. Whether you're building trading strategies, financial dashboards, or stock research platforms, access to accurate, structured historical stock market data is essential.

The challenge? Most data providers either limit access, offer incomplete datasets, or require complex integrations.

That’s where the Finage API changes the game. With a simple, developer-friendly interface, you can access years of historical stock prices, OHLCV charts, corporate actions, and more—directly into your app or system.


Table of Contents

- Why Historical Data Still Matters in Real-Time Markets

- Key Types of Historical Stock Data Available via API

- From Charts to Corporate Events: What Finage Covers

- How Developers Integrate Historical Feeds into Apps

- Querying Historical Data with the Finage API

- Final Thoughts 


1. Why Historical Data Still Matters in Real-Time Markets

With so much focus on real-time alerts and instant execution, it’s easy to underestimate the value of historical data. But for most fintech use cases, history is where the insight begins.

Here’s why:

- Strategy Backtesting
You can't deploy a reliable trading algorithm without stress-testing it against years of market data.

- Performance Benchmarking
Historical prices let you measure how assets perform over time, compare against indexes, and calculate long-term risk-return profiles.

- Financial Education & Research Tools
Many platforms for retail investors use historical charts and returns to help users understand market behavior and asset volatility.

- Compliance & Reporting
Historical market events, dividend histories, and split data are often required for regulatory filings and portfolio disclosures.

Even in automated systems, historical context helps bots calibrate volatility, optimize entry logic, and avoid high-risk zones.

Having deep, accurate history is not optional—it’s foundational.


2. Key Types of Historical Stock Data Available via API

Not all historical data is created equal. Developers and analysts need access to a wide range of datasets to support diverse use cases—from charting platforms to quant models.

Here’s a breakdown of what matters most:

OHLCV (Open, High, Low, Close, Volume)

The backbone of most charting and trading logic, OHLCV data helps you:

- Build historical candlestick charts

- Backtest technical indicators

- Detect volatility trends and volume spikes

Adjusted Close Data

Accounts for dividends and stock splits. This is crucial for long-term performance analysis and accurate portfolio valuation.

Dividend & Split History

Corporate actions affect price continuity. Access to these events ensures clean data for both visualization and backtesting.

End-of-Day (EOD) Snapshots

Provides a summary of each trading day’s final prices, ideal for financial dashboards and accounting systems.

Ticker-Level Metadata

Get static reference information like exchange codes, ISINs, and instrument status for historical tickers.

With Finage’s API, these data types are unified under one schema and delivered via simple endpoints—so you spend less time cleaning data and more time building.


3. From Charts to Corporate Events — What Finage Covers

A complete historical dataset goes far beyond just price candles. If your app, platform, or model is serious about accuracy and completeness, you’ll want access to broader financial context as well.

Here’s what Finage delivers through its historical stock data endpoints:

- Price & Chart Data

- Intraday and end-of-day OHLCV

- Adjustable timeframes: minute, hourly, daily

- Data available for thousands of global tickers

- Support for long time ranges—years of depth

- Corporate Events

- Historical dividend payouts with timestamps and values

- Stock splits and reverse splits with adjustment ratios

- Earnings announcements and relevant metadata

- Symbol & Market Metadata

- Exchange info, sector classification, instrument type

- Tracking of inactive or delisted symbols for historical completeness

- Support for rebranded tickers or mergers

- Regional & Cross-Market Support

Whether you’re tracking NYSE stocks, European shares, or ETFs, Finage’s coverage spans multiple countries and exchanges, standardized in one API.

By offering a single source of truth for both price data and market context, Finage helps developers avoid the headaches of stitching together partial datasets.


4. How Developers Integrate Historical Feeds into Apps

Accessing historical data isn’t just about downloading CSVs or filling up a database. The real value comes when this data flows directly into apps, dashboards, and backend systems—ready to be queried, visualized, or analyzed.

Here’s how developers typically use historical APIs in real-world products:

- Financial Dashboards

Stock research platforms and investment apps use historical APIs to populate:

- Interactive candlestick and line charts

- Long-term performance metrics

- Comparison tools for indices vs. stocks

With data piped in via API, everything stays up to date without manual syncing.

- Backtesting Engines

Quant developers rely on consistent OHLCV and event data to simulate how strategies would’ve performed in various market conditions.

Finage’s structured historical feed ensures clean and complete data, free from gaps or misaligned timeframes.

- Reporting & Compliance Tools

Apps that generate financial reports—whether for internal ops or investor disclosure—use historical data to:

- Validate portfolio valuation

- Track historical dividend income

- Maintain audit-friendly logs of price movements

- Data Science Pipelines

Python notebooks, machine learning models, and analytics platforms often use the API to pull structured history into pandas dataframes or cloud-based storage for analysis.

And with Finage’s REST endpoints, querying is straightforward and designed with developers in mind.


5. Querying Historical Data with the Finage API

Getting historical stock data with Finage doesn’t require a complex setup. The API is designed to be both developer-friendly and scalable for high-volume use.

Here’s how the integration typically works:

Step 1: Choose the Right Endpoint

Finage offers several endpoints under its Stock API, each tailored to different use cases:

- /stock/ohlcv for historical OHLCV data

- /stock/dividends for dividend events

- /stock/splits for stock split records

- /stock/eod for end-of-day summaries

Each endpoint accepts parameters like ticker, date range, and frequency—so you can target exactly the data you need.

Step 2: Format the Request

The API uses REST conventions. You’ll typically define:

- The symbol (e.g., AAPL, MSFT)

- Timeframe (daily, 1h, 1m, etc.)

- Start and end dates in ISO format

- Your API key for authentication

Finage’s documentation includes sample responses, data structure definitions, and usage notes to guide your integration.

Step 3: Scale As You Grow

The API supports pagination and bulk queries, meaning you can start with small test cases and scale to thousands of symbols as needed. Rate limits and usage tiers are outlined clearly in your developer dashboard.

Whether you're building a single-dashboard app or a large-scale data engine, Finage's consistency and reliability make it easy to trust the output.


6. Final Thoughts

Historical data is more than just a record of past prices—it’s a roadmap for decision-making, product innovation, and investor transparency. Whether you're backtesting a new strategy, building educational tools, or powering a client dashboard, the depth and reliability of your data matter.

With the Finage Stock API, you get access to:

- Clean and structured OHLCV data

- Corporate actions like splits and dividends

- Multi-exchange coverage and long-term history

- REST endpoints designed for real developers

Stop relying on outdated or incomplete datasets. Start building with a provider that gives you the confidence to scale—and the historical insight to stay competitive.

Explore the Finage documentation and integrate historical stock data directly into your product today.

Share article

linkedinXFacebookInstagram

Claim Your Free API Key Today

Access stock, forex and crypto market data with a free API key—no credit card required.

Logo Pattern Desktop

Stay Informed, Stay Ahead

Finage Blog: Data-Driven Insights & Ideas

Discover company news, announcements, updates, guides and more

Finage Logo
TwitterLinkedInInstagramGitHubYouTubeEmail
Finage is a financial market data and software provider. We do not offer financial or investment advice, manage customer funds, or facilitate trading or financial transactions. Please note that all data provided under Finage and on this website, including the prices displayed on the ticker and charts pages, are not necessarily real-time or accurate. They are strictly intended for informational purposes and should not be relied upon for investing or trading decisions. Redistribution of the information displayed on or provided by Finage is strictly prohibited. Please be aware that the data types offered are not sourced directly or indirectly from any exchanges, but rather from over-the-counter, peer-to-peer, and market makers. Therefore, the prices may not be accurate and could differ from the actual market prices. We want to emphasize that we are not liable for any trading or investing losses that you may incur. By using the data, charts, or any related information, you accept all responsibility for any risks involved. Finage will not accept any liability for losses or damages arising from the use of our data or related services. By accessing our website or using our services, all users/visitors are deemed to have accepted these conditions.
Finage LTD 2025 © Copyright